

Key work health and safety statistics Australia 2022
Key Work Health and Safety Statistics, Australia 2022 provides an overview of the latest national data on work-related fatalities and workers’ compensation claims. This includes trends, gender and age comparisons, and industry and occupation breakdowns.
Downloads
The report was updated 17 January 2023. The update affected page 11 of the report only.
The costs of work-related injuries and diseases are not included in Key Work Health and Safety Statistics, Australia 2022. To find out more about these costs read the Safer, healthier, wealthier: The economic value of reducing work-related injuries and illnesses – summary report.
This includes trends, gender and age comparisons, and industry and occupation breakdowns for work health and safety and serious workers’ compensation claims in Australia.
The costs of work-related injuries and diseases are not included in Key Work Health and Safety Statistics, Australia 2021.
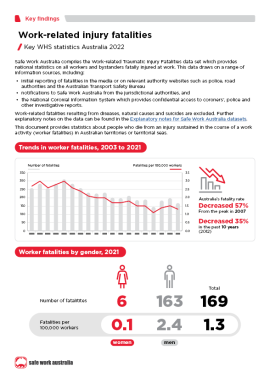
Work-related injury fatalities
Safe Work Australia compiles the Work-related Traumatic Injury Fatalities data set which provides national statistics on all workers and bystanders fatally injured at work. This data draws on a range of information sources, including:
- initial reporting of fatalities in the media or on relevant authority websites such as police, road authorities and the Australian Transport Safety Bureau
- notifications to Safe Work Australia from the jurisdictional authorities, and
- the National Coronial Information System which provides confidential access to coroners’, police and other investigative reports.
Work-related fatalities resulting from diseases, natural causes and suicides are excluded. Further explanatory notes on the data can be found in the Explanatory notes for Safe Work Australia datasets.
This document provides statistics about people who die from an injury sustained in the course of a work activity (worker fatalities) in Australian territories or territorial seas.
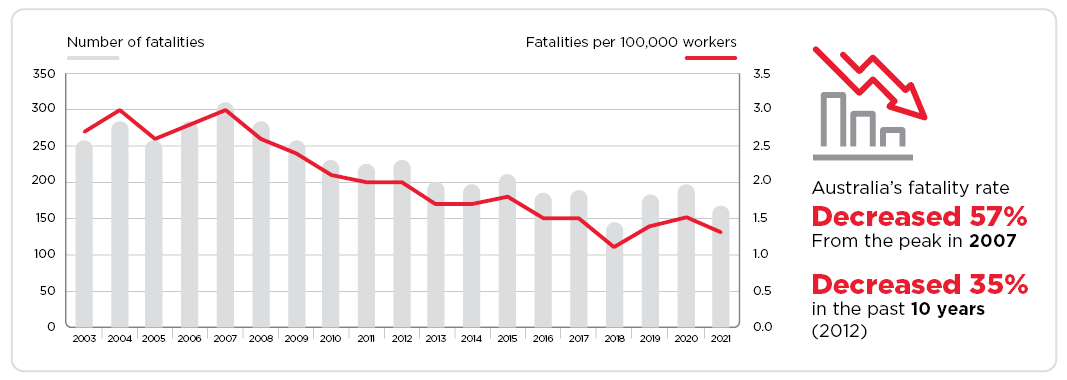
Trends in worker fatalities, 2003 to 2021
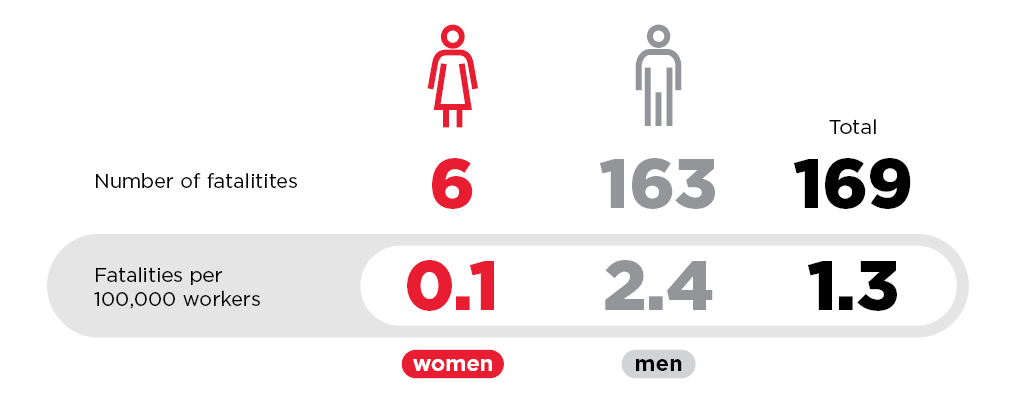
Worker fatalities by gender, 2021
Worker fatalities by age group, 2021
| Age group (years) | Number of fatalities | Fatality rate (fatalities per 100,000 workers) |
|---|---|---|
| Under 25 | 16 | 0.9 |
| 25-34 | 22 | 0.7 |
| 35-44 | 26 | 0.9 |
| 45-54 | 33 | 1.2 |
| 55-64 | 43 | 2.2 |
| 65 and over | 29 | 4.5 |
| Total | 169 | 1.3 |
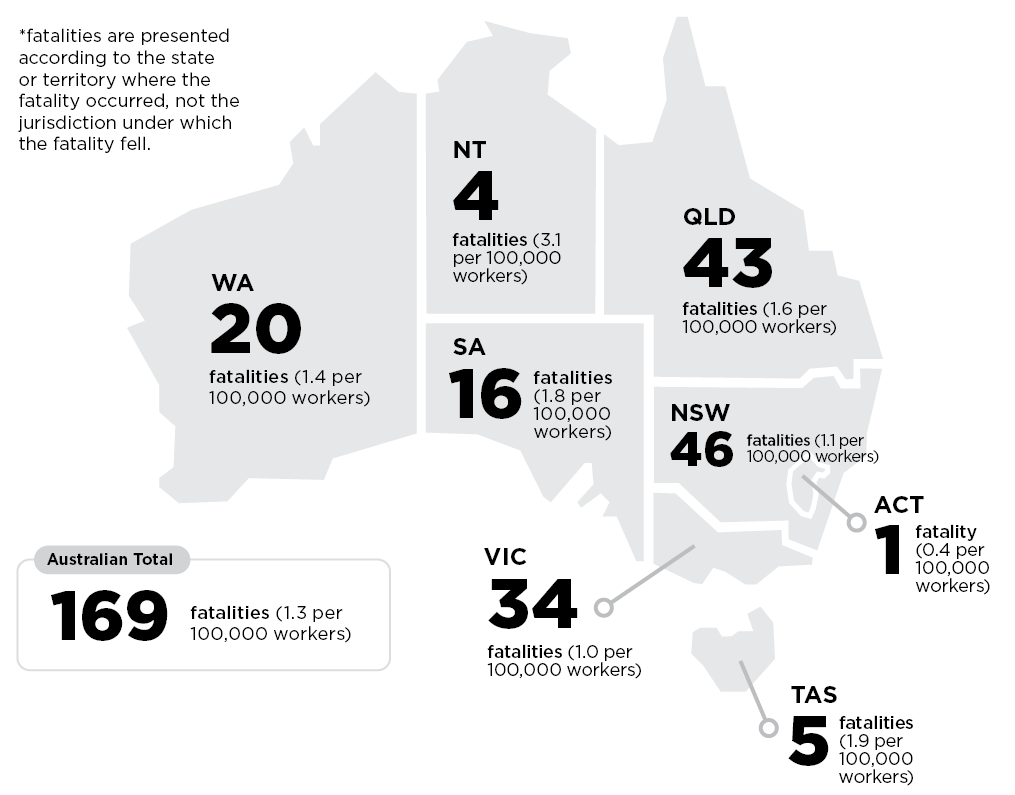
Worker fatalities by state/territory, 2021*
*fatalities are presented according to the state or territory where the fatality occurred, not the jurisdiction under which the fatality fell.
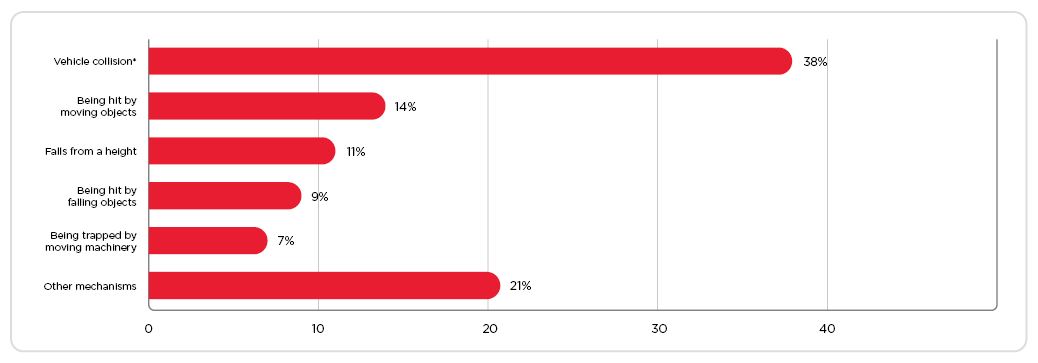
Worker fatalities by mechanism of incident, 2021
Note:
- only mechanisms accounting for 5% or more of fatalities are included. The remaining mechanisms are grouped together under other mechanisms.
- the percentages shown in this table have been rounded to the nearest whole number; therefore the sum of percentage figures for each column may not equal the total.
| Mechanism of incident | Number of fatalities | % of fatalities |
|---|---|---|
| Vehicle collision* | 64 | 38% |
| Being hit by moving objects | 24 | 14% |
| Falls from a height | 19 | 11% |
| Being hit by falling objects | 16 | 9% |
| Being trapped by moving machinery | 11 | 7% |
| Other mechanisms | 35 | 21% |
| Total | 169 | 100% |
*vehicle collisions include fatalities that occurred as a direct result of a vehicle crash. Vehicles include not only road vehicles such as cars and trucks, but also machines such as aircraft, boats, loaders, tractors and quad bikes.
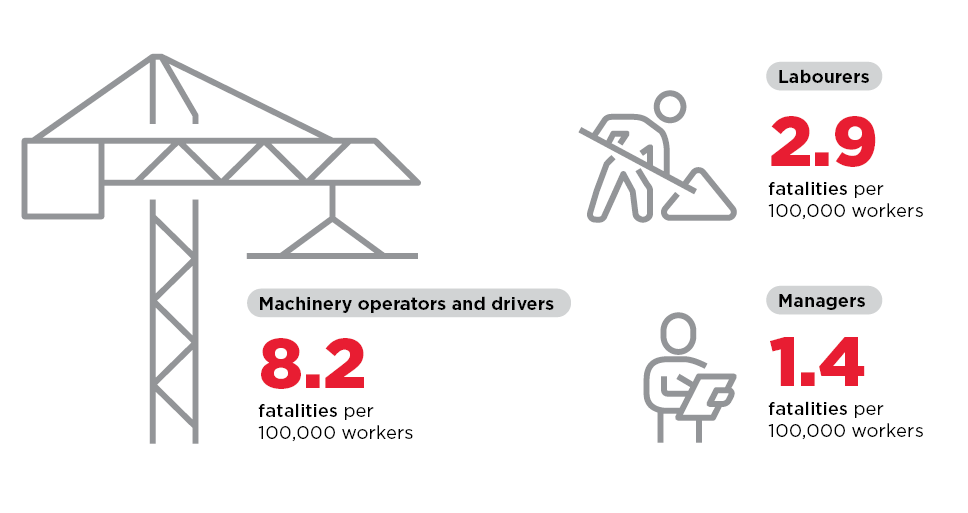
Worker fatalities by occupation, 2021
| Occupation | Number of fatalities | Fatality rate (fatalities per 100,000 workers) |
|---|---|---|
| Machinery operators and drivers | 68 | 8.2 |
| Labourers | 34 | 2.9 |
| Managers | 24 | 1.4 |
| Technicians and trades workers | 22 | 1.2 |
| Community and personal service workers | 12 | 0.8 |
| Professionals | 6 | 0.2 |
| Sales workers | 2 | 0.2 |
| Clerical and administrative workers | 1 | 0.1 |
| Total | 169 | 1.3 |
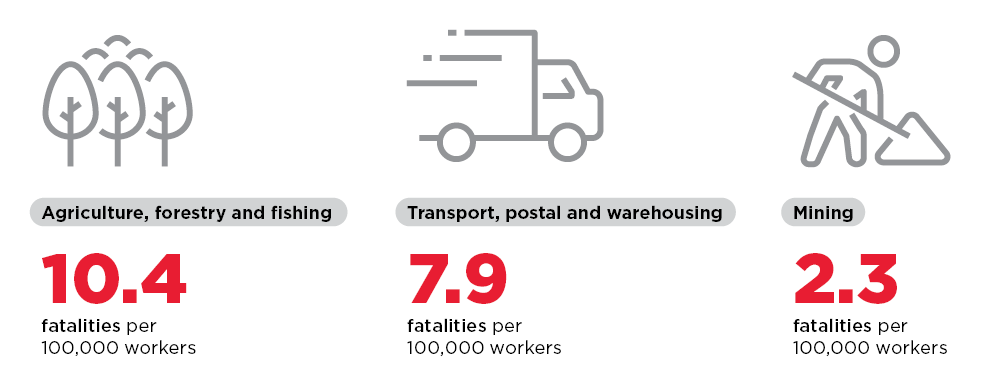
Worker fatalities by industry, 2021
| Industry of employer | Number of fatalities | Fatality rate (fatalities per 100,000 workers) |
|---|---|---|
| Agriculture, forestry and fishing | 33 | 10.4 |
| Transport, postal and warehousing | 52 | 7.9 |
| Mining | 6 | 2.3 |
| Construction | 24 | 2.1 |
| Arts and recreation services | 5 | 2.1 |
| Electricity, gas, water and waste services | 3 | 2.1 |
| Manufacturing | 16 | 1.8 |
| Administrative and support services | 5 | 1.2 |
| Wholesale trade | 4 | 1.1 |
| Rental, hiring and real estate services | 2 | 0.9 |
| Public administration and safety | 6 | 0.6 |
| Other services | 3 | 0.6 |
| Education and training | 4 | 0.4 |
| Accommodation and food services | 2 | 0.2 |
| Health care and social assistance | 2 | 0.1 |
| Professional, scientific and technical services | 1 | 0.1 |
| Retail trade | 1 | 0.1 |
| Financial and insurance services | 0 | 0 |
| Information media and telecommunications | 0 | 0 |
| Total | 169 | 1.3 |
Work-related injury and disease
Safe Work Australia compiles the National Dataset for Compensation-based Statistics (NDS) which comprises information on workers’ compensation claims provided by each of the jurisdictional workers’ compensation authorities.
Data in this report refers to serious claims only. Serious claims include all accepted workers’ compensation claims for an incapacity that results in a total absence from work of one working week or more, excluding fatalities and journey claims. Data for 2019-20 are preliminary (denoted by a ‘p’) and subject to revision in future years as further claims are finalised. Further explanatory notes on the data can be found in the National data set for compensation-based statistics for Safe Work Australia.
Serious claims statistics, 2020-21p*
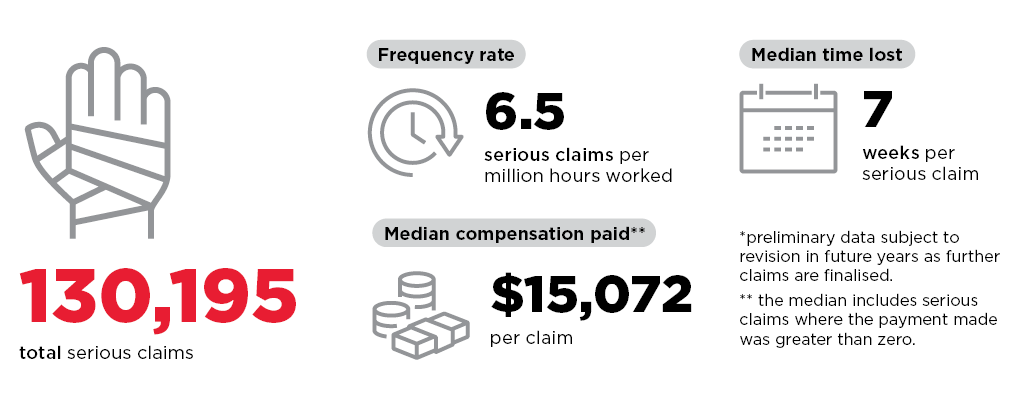
*preliminary data subject to revision in future years as further claims are finalised.
**the median includes serious claims where the payment made was greater than zero.
Serious claim rate, 2000-01 to 2020-21*
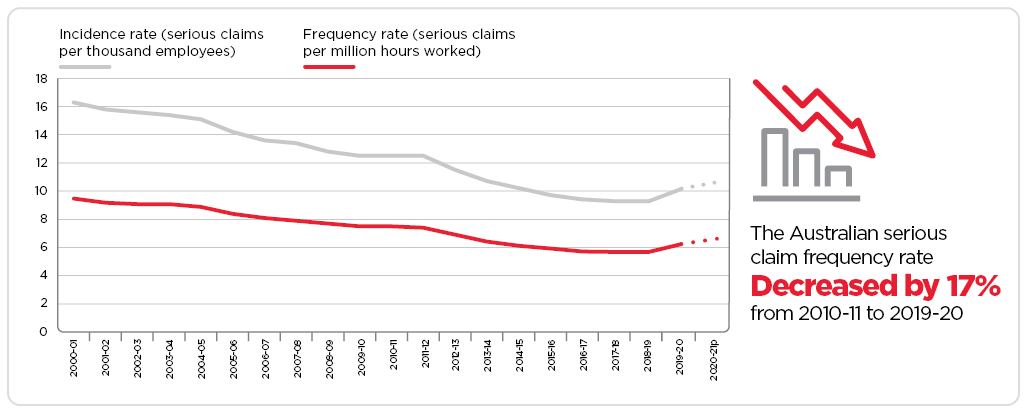
*preliminary data subject to revision in future years as further claims are finalised.
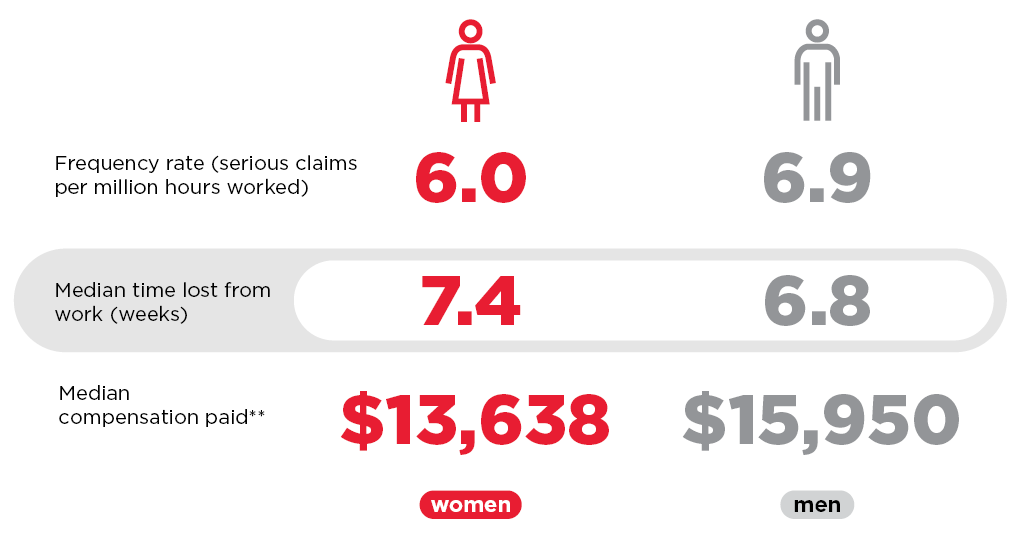
Serious claims by gender, 2020-21p*
| Gender | Number of serious claims | Frequency rate (serious claims per million hours worked) | Incidence rate (serious claims per thousand employees) |
|---|---|---|---|
| Female | 50,929 | 6.0 | 8.5 |
| Male | 79,083 | 6.9 | 12.5 |
| Total*** | 130,195 | 6.5 | 10.5 |
*preliminary data subject to revision in future years as further claims are finalised.
**the median includes serious claims where the payment made was greater than zero.
***the totals include serious claims where gender was not collected or is unknown.
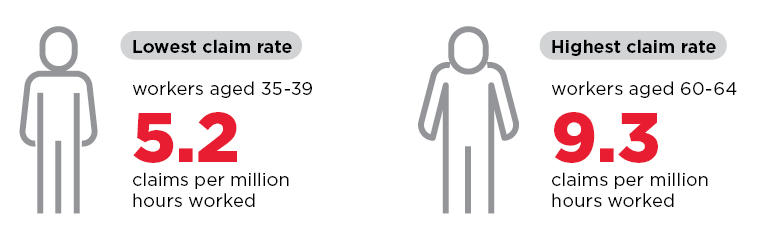
Serious claims by age group, 2020-21p*
| Age group (years) | Number of serious claims | Frequency rate (serious claims per million hours worked) | Incidence rate (serious claims per thousand employees) |
|---|---|---|---|
| Under 20 | 4.581 | 7.5 | 6.5 |
| 20-24 | 11,905 | 6.9 | 9.7 |
| 25-29 | 13,693 | 5.6 | 9.4 |
| 30-34 | 13,567 | 5.3 | 9.1 |
| 35-39 | 13,035 | 5.2 | 8.9 |
| 40-44 | 12,631 | 5.6 | 9.8 |
| 45-49 | 15,161 | 6.6 | 11.8 |
| 50-54 | 15,908 | 7.7 | 13.4 |
| 55-59 | 14,856 | 8.4 | 14.1 |
| 60-64 | 10,515 | 9.3 | 14.8 |
| 65 and over | 4,343 | 7.1 | 9.2 |
| Total | 130,195 | 6.5 | 10.5 |
*preliminary data subject to revision in future years as further claims are finalised.
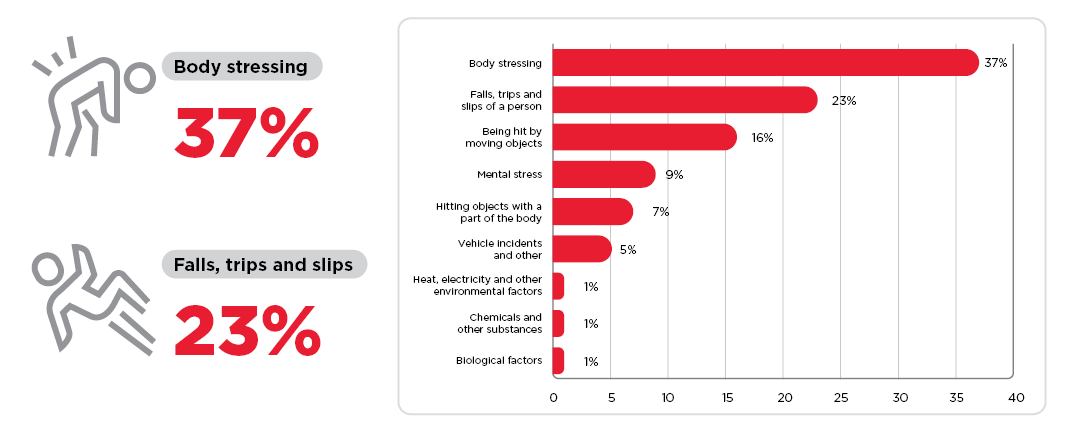
Serious claims by mechanism of incident, 2020-21p*
| Mechanism of incident | Number of serious claims | % of serious claims**** | ||||
|---|---|---|---|---|---|---|
| Female | Male | Total | Female | Male | Total | |
| Body stressing | 18,574 | 29,710 | 48,358 | 36% | 38% | 37% |
| Falls, trips and slips of a person | 13,071 | 16,935 | 30,039 | 26% | 21% | 23% |
| Being hit by moving objects | 6,699 | 13,623 | 20,339 | 13% | 17% | 16% |
| Mental stress | 6,418 | 4,682 | 11,109 | 13% | 6% | 9% |
| Hitting objects with a part of the body | 2,250 | 7,260 | 9,535 | 4% | 9% | 7% |
| Vehicle incidents and other*** | 2,319 | 4,786 | 7,124 | 5% | 6% | 5% |
| Heat, electricity and other environmental factors | 717 | 999 | 1,721 | 1% | 1% | 1% |
| Chemicals and other substances | 408 | 678 | 1,086 | 1% | 1% | 1% |
| Total** | 50,929 | 79,083 | 130,195 | 100% | 100% | 100% |
*preliminary data subject to revision in future years as further claims are finalised.
**the total for serious claims includes other mechanisms of incident such as biological factors, sound and pressure, roll over, slide or cave-in, and other multiple or unspecified mechanisms of incident.
***vehicle collisions include claims where the injury was the direct result of a vehicle crash. Vehicles include not only road vehicles such as cars and trucks, but also machines such as aircraft, boats, loaders, tractors and quad bikes.
****percentages are rounded to the nearest decimal place and may not sum to total.
*****the totals include serious claims where gender was not collected or is unknown.
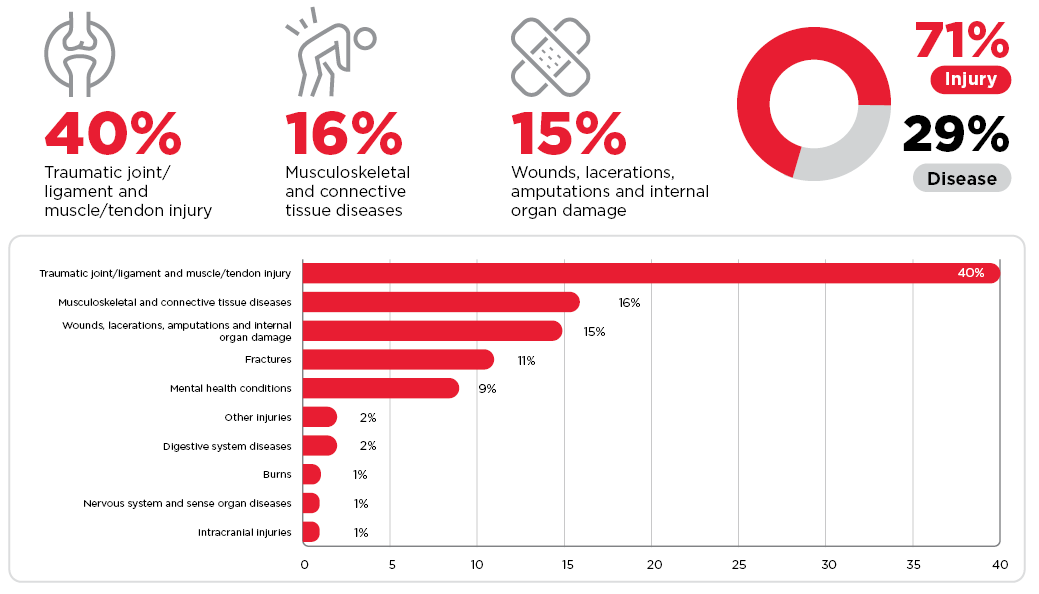
Serious claims by nature of injury/disease, 2020-21p*
| Mechanism of incident | Number of serious claims | % of serious claims**** | ||||
|---|---|---|---|---|---|---|
| Female | Male | Total | Female | Male | Total | |
| Traumatic joint/ligament and muscle/tendon injury | 20,926 | 31,310 | 52,316 | 41% | 40% | 40% |
| Musculoskeletal and connective tissue diseases | 9,035 | 11,901 | 20,965 | 18% | 15% | 16% |
| Wounds, lacerations, amputations and internal organ damage | 5,112 | 14,348 | 19,485 | 10% | 18% | 15% |
| Fractures | 4,792 | 8,925 | 13,732 | 9% | 11% | 11% |
| Mental health conditions | 6,899 | 5,244 | 12,155 | 14% | 7% | 9% |
| Other injuries** | 1,070 | 1,882 | 2,952 | 2% | 2% | 2% |
| Digestive system diseases | 111 | 1,874 | 1,989 | 0% | 2% | 2% |
| Burn | 697 | 1,147 | 1,850 | 1% | 1% | 1% |
| Nervous system and sense organ diseases | 717 | 755 | 1,475 | 1% | 1% | 1% |
| Intracranial injuries | 577 | 618 | 1,199 | 1% | 1% | 1% |
| Total*** | 50,929 | 79,083 | 130,195 | 100% | 100% | 100% |
*preliminary data subject to revision in future years as further claims are finalised.
**other injuries include those related to poisoning, electrocution, air pressure, weather conditions, unspecified injuries and injuries not classified elsewhere.
***injuries or diseases accounting for less than 1% of serious claims are not included separately, but are included in the total.
****percentages are rounded to the nearest decimal place and may not sum to total.
*****the totals include serious claims where gender was not collected or is unknown.
Mental health conditions, 2020-21p*
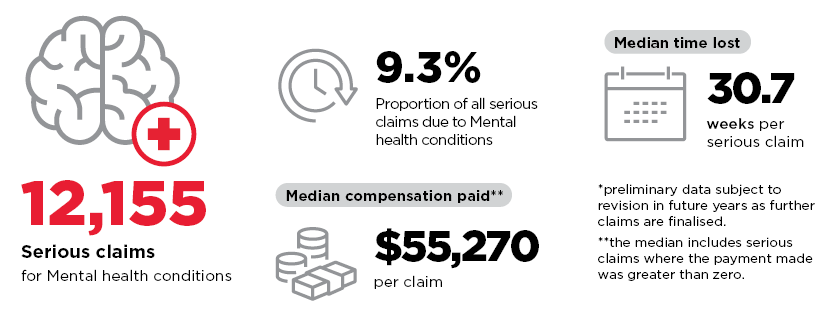
- Mental health conditions account for a relatively small but increasing proportion of serious claims, rising from 6.2% of all serious claims in 2014-15 to 9.3% in 2020-21p.
- In 2020-21, the largest share related to anxiety or stress disorders (36%) or reaction to stressors – other, multiple or not specified (34%).
- Workplace mental health conditions are one of the costliest forms of workplace injury. Our data show that they lead to significantly more time off work and higher compensation paid when compared to physical injuries and diseases. In 2019-20:
- The median time lost for mental health conditions was 30.7 working weeks per serious claim, compared to 6.2 working weeks per serious claim for physical injuries and diseases.
- The median compensation paid was $55,270 per serious claim, compared to $13,883 for physical injuries and diseases.
- The median time lost (in working weeks) for mental health conditions has increased markedly in recent years, from 18.8 working weeks in 2015‑16 to 30.7 working weeks in 2019-20.
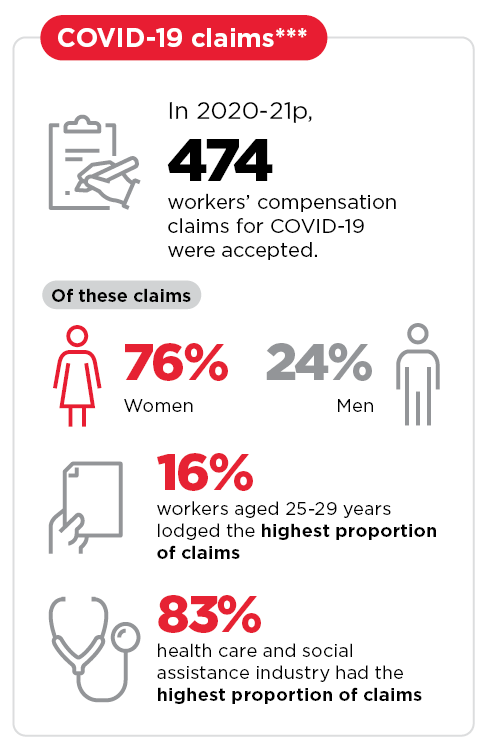
COVID-19 claims***
*preliminary data subject to revision in future years as further claims are finalised.
**the median includes serious claims where the payment made was greater than zero.
***the COVID workers’ compensation claims data need to be interpreted carefully in the context of the reference period for this data, the difficulty in establishing a work connection to transmission of the virus and the possibility that workers with COVID-19 may not have applied for compensation and instead used personal leave.
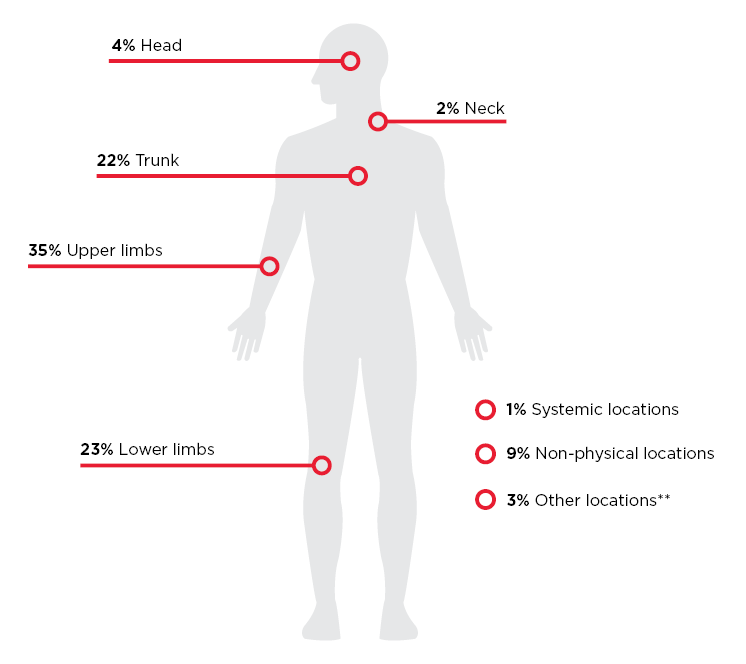
Serious claims by bodily location of injury, 2020-21p*
| Bodily location of injury/disease | Number of serious claims | % of serious claims**** |
|---|---|---|
| Head | 4,784 | 4% |
| Lower limbs | 30,081 | 23% |
| Multiple locations | 4,467 | 3% |
| Neck | 2,652 | 2% |
| Non-physical locations | 12,134 | 9% |
| Systemic locations | 938 | 1% |
| Trunk | 28,560 | 22% |
| Upper limbs | 45,993 | 35% |
| Total*** | 130,195 | 100% |
*preliminary data subject to revision in future years as further claims are finalised.
**other locations include multiple locations, systemic locations, and trunk excluding chest and abdomen.
***claims where the bodily location was unknown are not included separately, but are included in the total.
****percentages are rounded to the nearest decimal place and may not sum to total.
Serious claims by occupation, 2020-21p*
Due to an issue with processing occupational data for a small proportion of workers’ compensation claims, this part of the report was updated 22 November 2022.
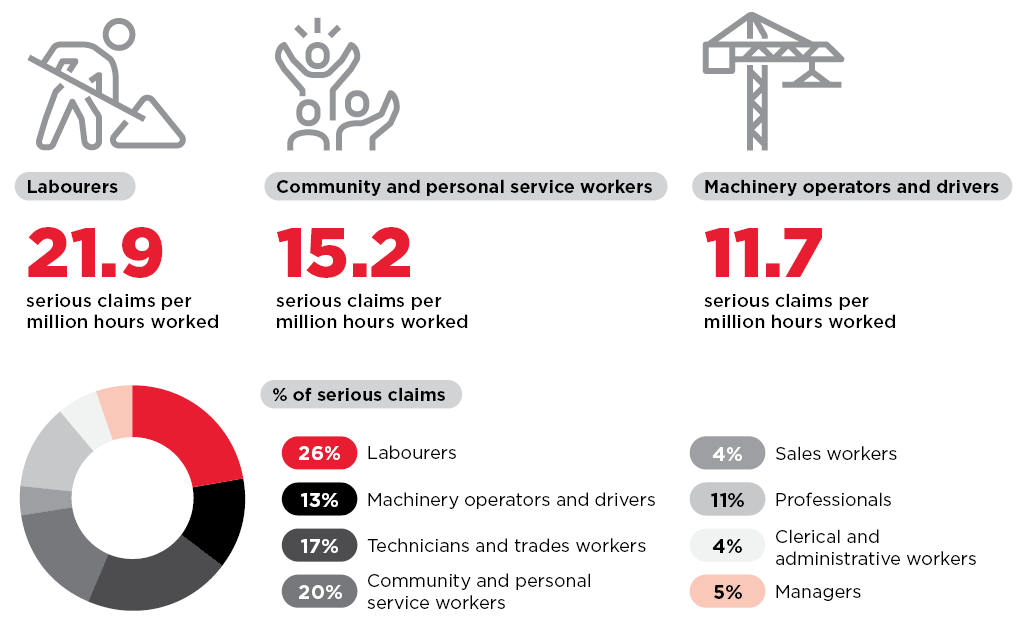
| Occupation | Number of serious claims | Frequency rate (serious claims per million hours worked) | Incidence rate (serious claims per thousand employees) |
|---|---|---|---|
| Labourers | 3,309 | 21.9 | 30.5 |
|
Community and personal service workers |
26,245 | 15.2 | 19.2 |
|
Machinery operators and drivers |
16,443 | 11.7 | 21.8 |
| Technicians and trades workers | 22,255 | 7.9 | 14.5 |
| Sales workers | 4,825 | 3.6 | 4.4 |
| Professionals | 14,126 | 2.6 | 4.3 |
| Managers | 5,925 | 2.0 | 3.9 |
| Clerical and administrative workers | 5,536 | 2.1 | 3.2 |
| Total** | 130,195 | 6.5 | 10.5 |
*preliminary data subject to revision in future years as further claims are finalised.
**claims where the occupation was unknown are not included separately, but are included in the total.
Serious claims by industry, 2020-21p*
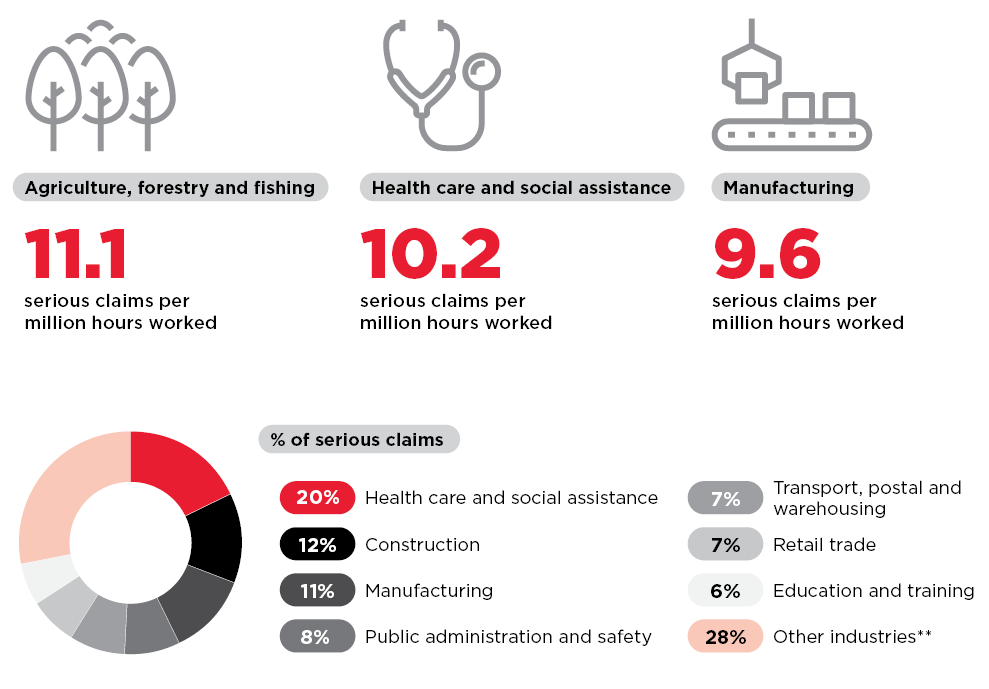
| Industry | Number of serious claims | Frequency rate (serious claims per million hours worked) | Incidence rate (serious claims per thousand employees) |
|---|---|---|---|
| Agriculture, forestry and fishing | 4,159 | 11.1 | 20.2 |
| Health care and social assistance | 26,239 | 10.2 | 14.6 |
| Manufacturing | 14,663 | 9.6 | 17.6 |
| Construction | 16,088 | 8.8 | 16.9 |
| Transport, postal and warehousing | 9,122 | 8.8 | 15.8 |
| Wholesale trade | 5,352 | 8.0 | 14.7 |
| Administrative and support services | 5,364 | 7.9 | 12.1 |
| Arts and recreation services | 2,195 | 7.6 | 9.7 |
| Public administration and safety | 10,481 | 7.1 | 11.8 |
| Accommodation and food services | 6,890 | 7.0 | 8.2 |
| Other services | 3,648 | 5.5 | 8.9 |
| Mining | 2,806 | 5.2 | 11.2 |
| Retail trade | 8,986 | 5.1 | 7.0 |
| Education and training | 8,212 | 4.7 | 7.1 |
| Electricity, gas, water and waste services | 1,313 | 4.5 | 8.8 |
| Rental, hiring and real estate services | 1,128 | 3.2 | 5.7 |
| Information media and telecommunications | 574 | 1.8 | 3.1 |
| Professional, scientific and technical services | 2,290 | 1.2 | 2.1 |
| Financial and insurance services | 614 | 0.7 | 1.3 |
| Total** | 130,195 | 6.5 | 10.5 |
*preliminary data subject to revision in future years as further claims are finalised.
**other industries include all other industries excluding the top seven industries by number of serious claims.
NB: For some claims information about age, sex, industry and occupation is not available. Stated totals may therefore differ from the sums of rows or columns.
Due to a minor processing issue industry classifications for a very small number of workers’ compensation claims were revised on 11/11/2022. The final table in Key WHS statistics has been updated accordingly.
Publication Date:
Last updated:
Publication type: