

Infographic: Fatalities, injuries and solutions in construction
Because of the high levels of death and injury to construction workers, the Australian Work Health and Safety Strategy 2012-2022 focuses on this industry as a national priority.
Downloads
Data from the infographic
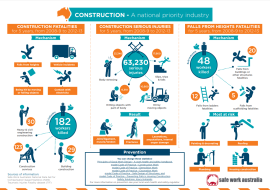
Construction fatalities
A total of 182 construction workers were killed in the five years from 2008–09 to 2012–13
| Industry Sub-sector | Number of workers killed |
|---|---|
| Construction services | 123 |
| Heavy and civil engineering construction | 30 |
| Building construction | 29 |
The most common mechanisms that caused fatalities were:
- Falls from heights
- Vehicle incidents
- Being hit by moving or falling objects
- Contact with electricity
Construction serious injuries
A total of 63,230 serious injuries were reported in the five years from 2008–9 to 2012–13. The most common types of injury were:
- Joint/ligament, muscle/tendon
- Fractures
- Wounds, lacerations, amputations, internal organ damage
The following table shows the main causes of serious injuries
| Cause of injury | Number of serious injuries |
|---|---|
| Body stressing | 23 340 |
| Slips, trips and falls | 17 660 |
| Hit by moving objects | 10 660 |
| Hitting objects with part of the body | 6310 |
Falls from heights fatalities
A total of 48 construction workers were killed by falls from heights in the five years from 2008-9 to 2012-13. The most at risk construction occupations for falls from heights fatalities were:
- Painting and decorating
- Roofing
- Plumbing
- Housing construction
The following table shows the main types of falls and numbers of workers killed:
| Industry Sub-sector | Number of workers killed |
|---|---|
| Falls from buildings or other structures | 20 |
| Falls from ladders | 12 |
| Falls from scaffolding | 5 |
Supporting information
- Work-related traumatic injury fatalities
- Incidence rates and frequency rates of serious claims by industry, 2011–12 to 2014–15
- Work Health and Safety Perceptions: Construction Industry
- Australian Work Health and Safety Strategy 2012–2022
- Australian Strategy national priority industries
Some solutions
Publication Date:
Last updated:
Publication type: